System architecture
End‑to‑end flow
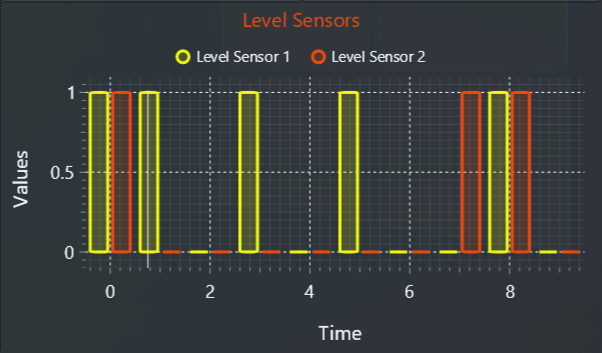
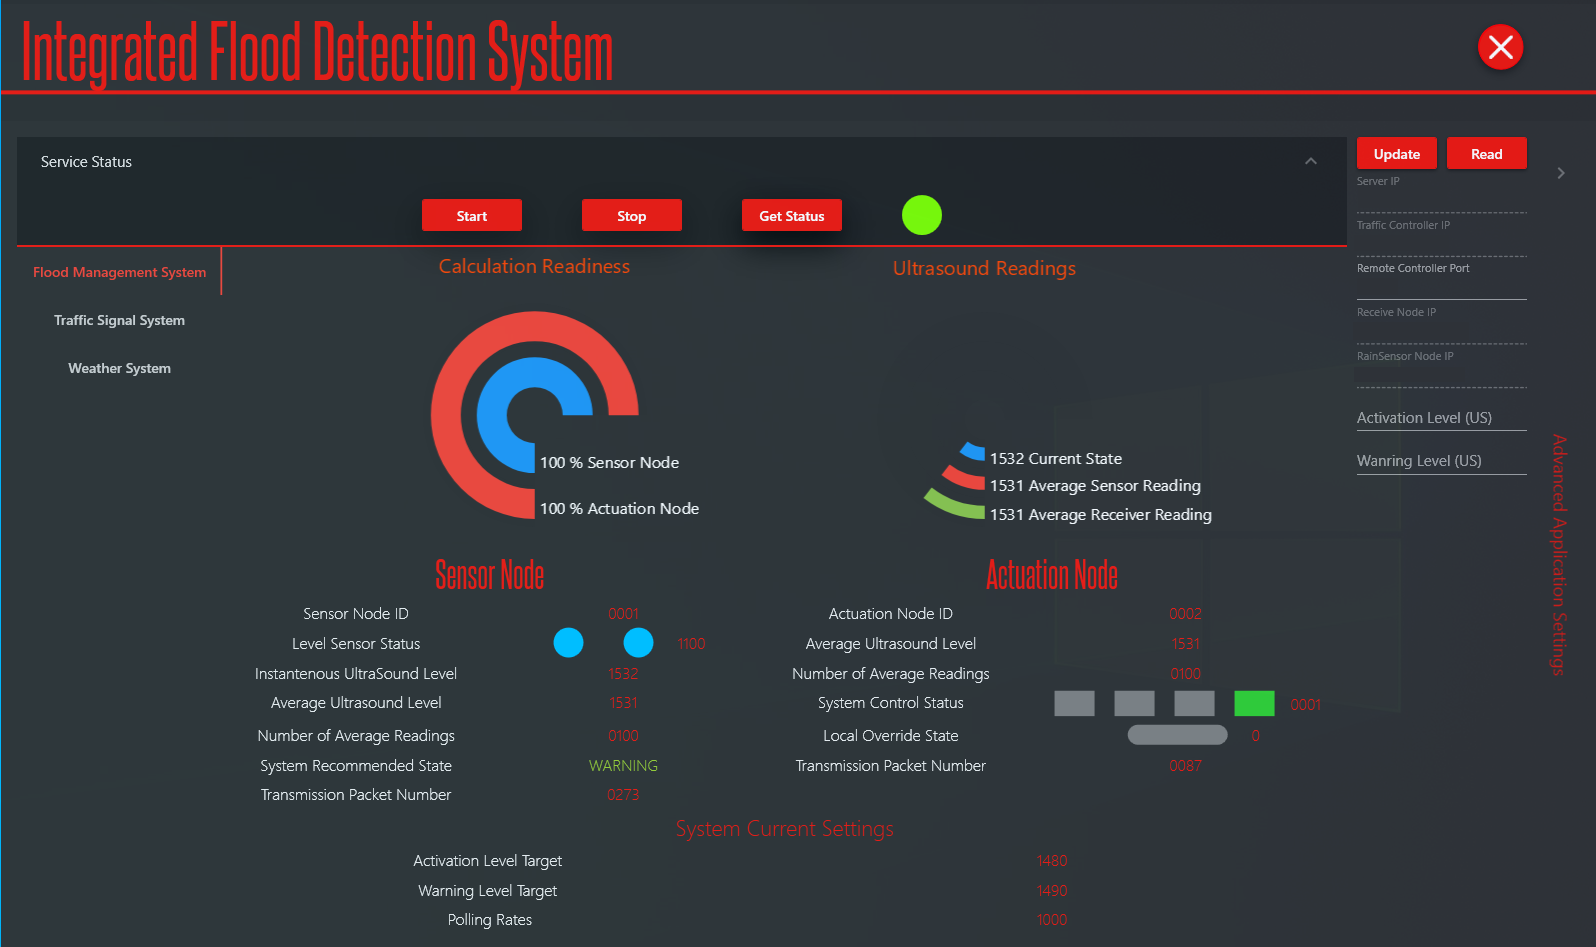
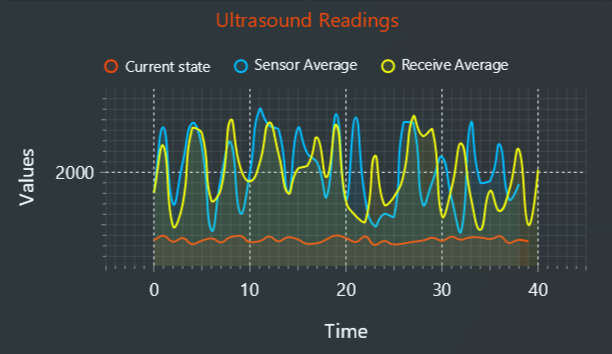
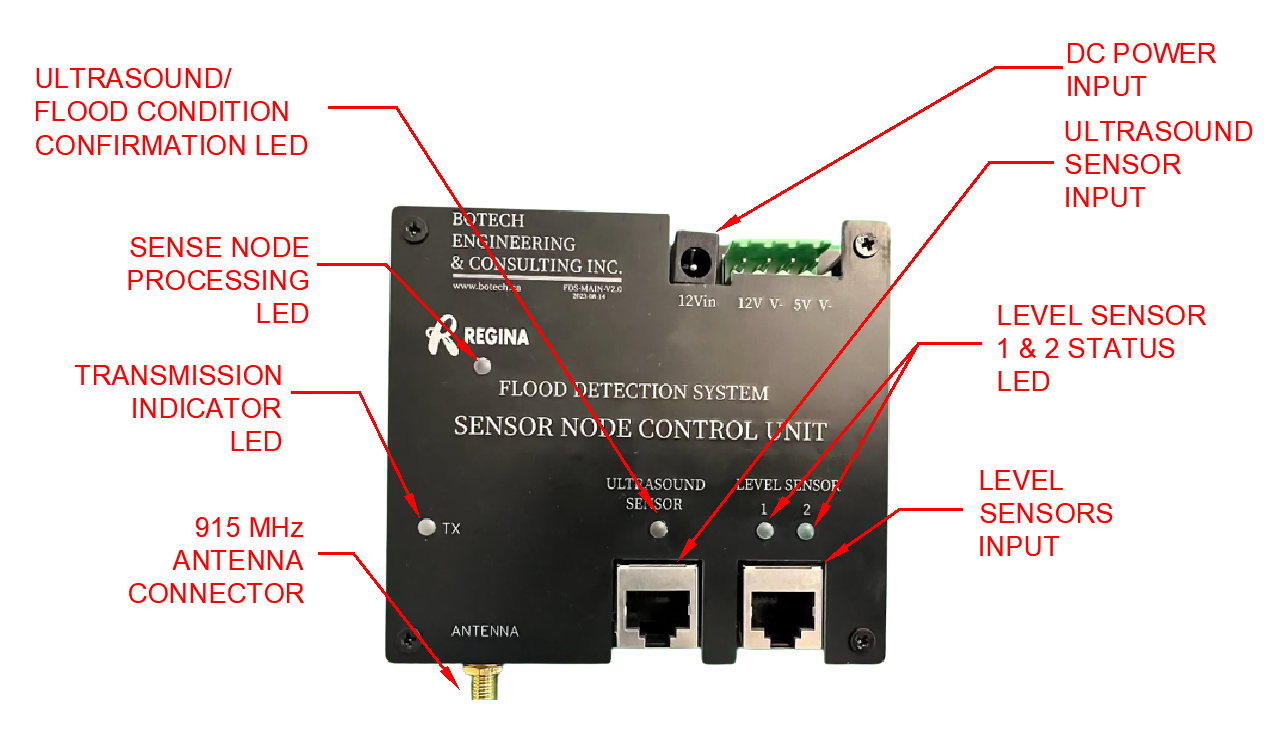
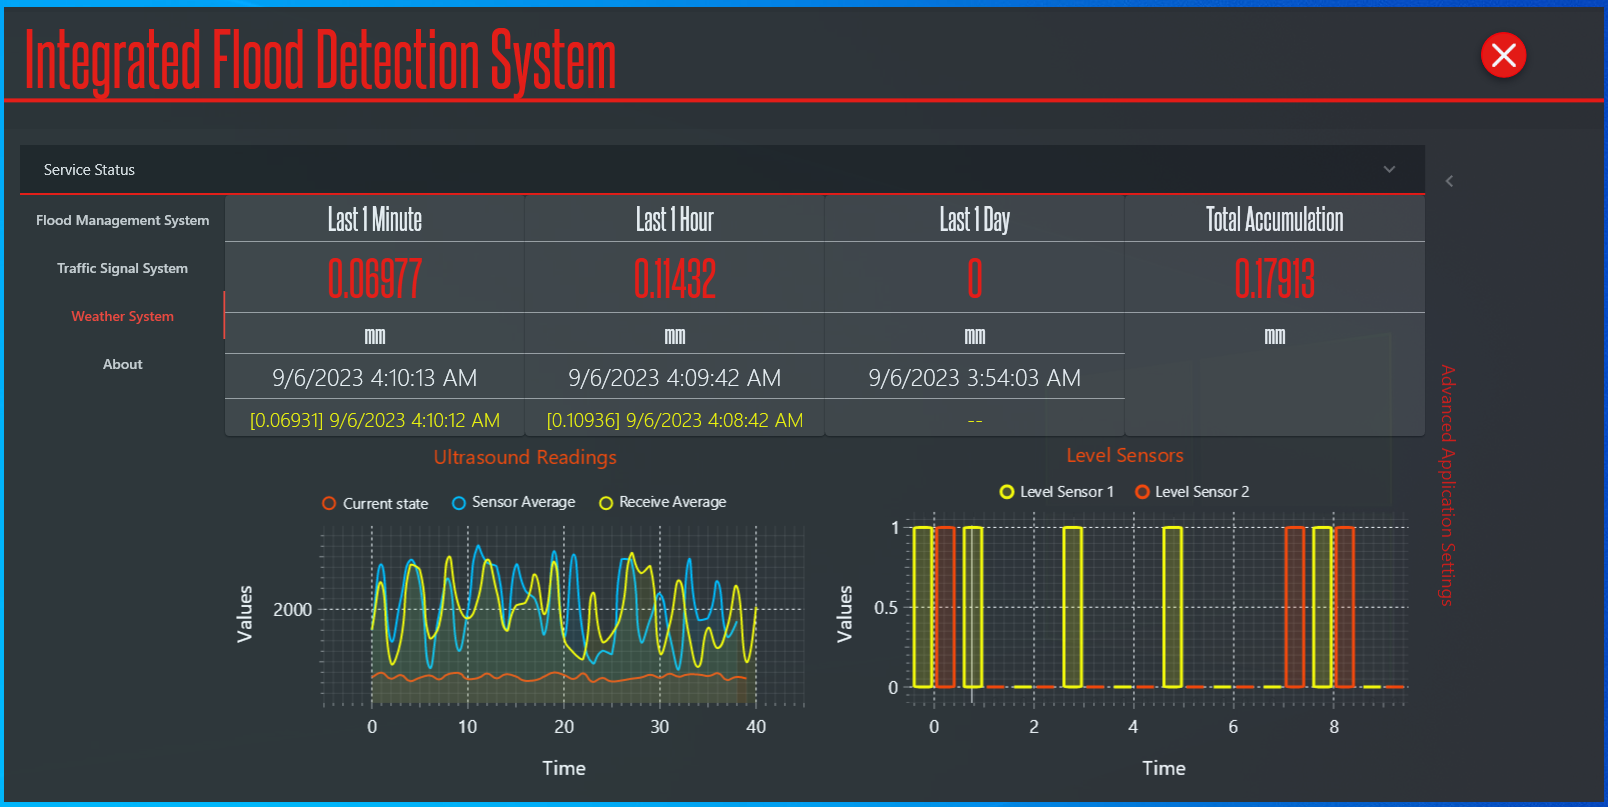
- Sensor polling @ 1 s → moving averages (100 samples) at sensor and/or receive node
- Receive node compares against Warning / Activation thresholds
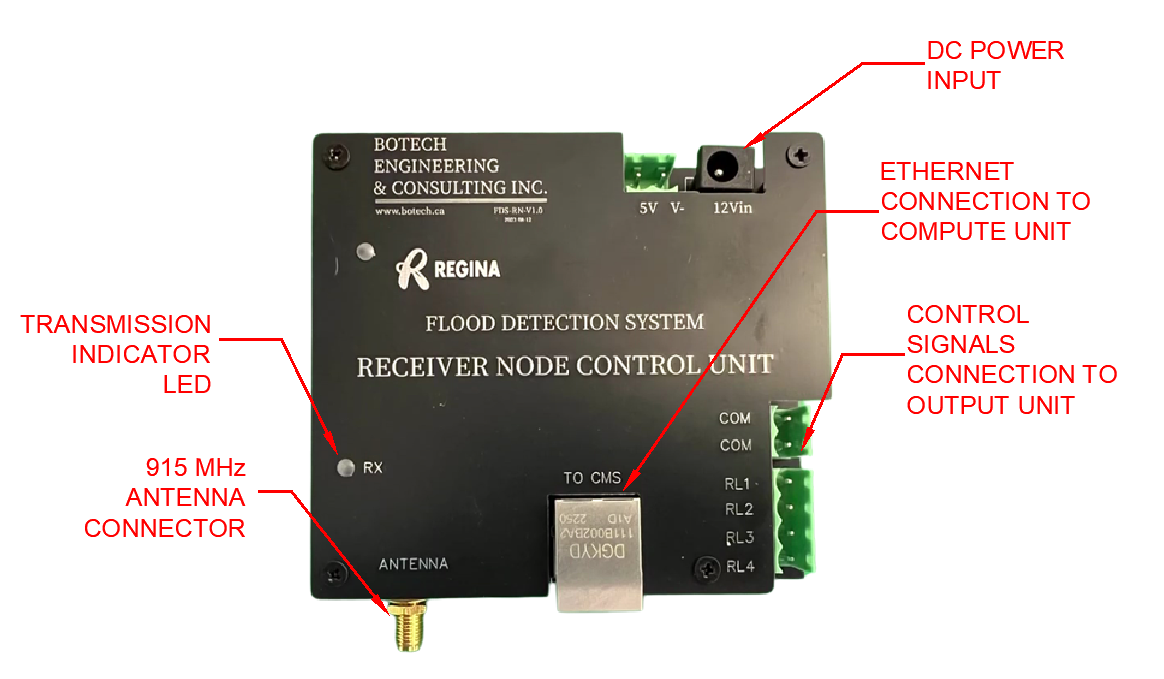
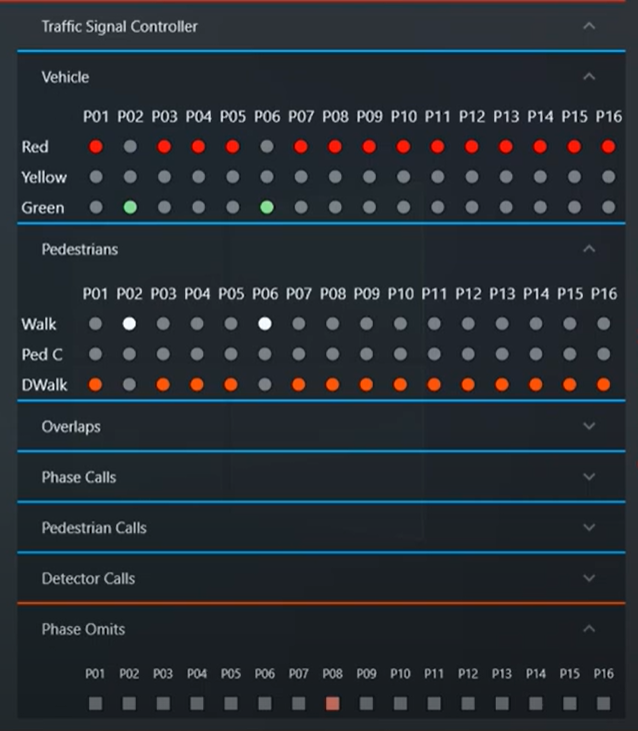
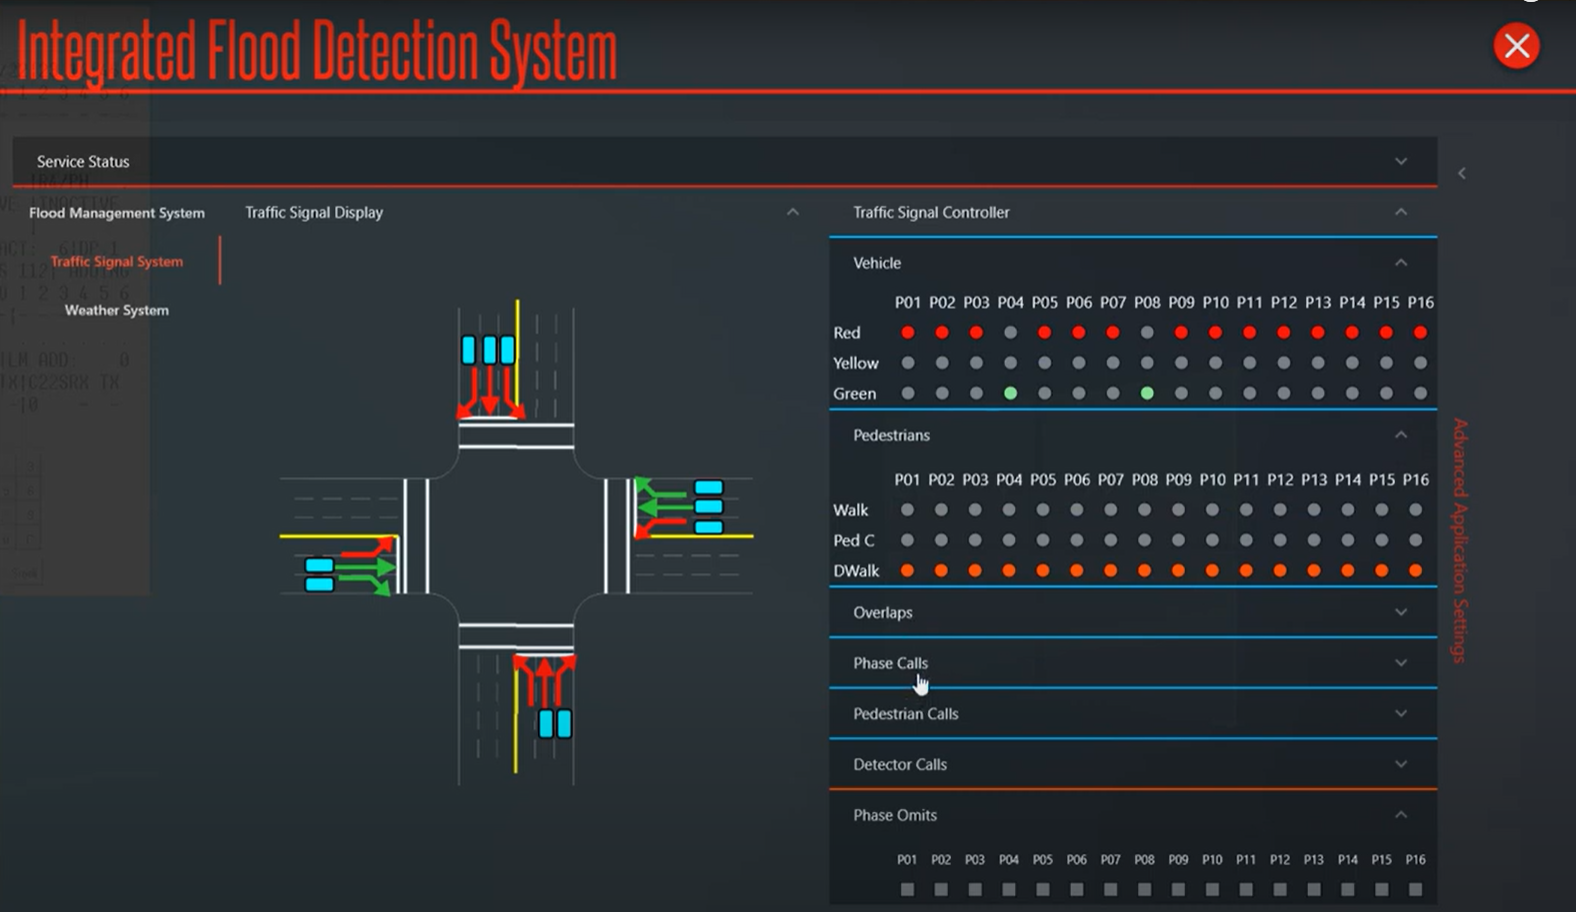
- Outputs actuate LED signs, logic inputs, and omit/aux requests to traffic signal
- Compute unit logs values and exposes IFMS interface (local display or RDP)
915 MHz radio • Moving average (100) • Override modes